The words “prevision” or “forecast” are to be banned of our vocabulary when we talk about energy scenarios, in particular for long term studies. Still, it is interesting to look backwards in old publications to see what were the projections 5, 10 or even 15 years ago.
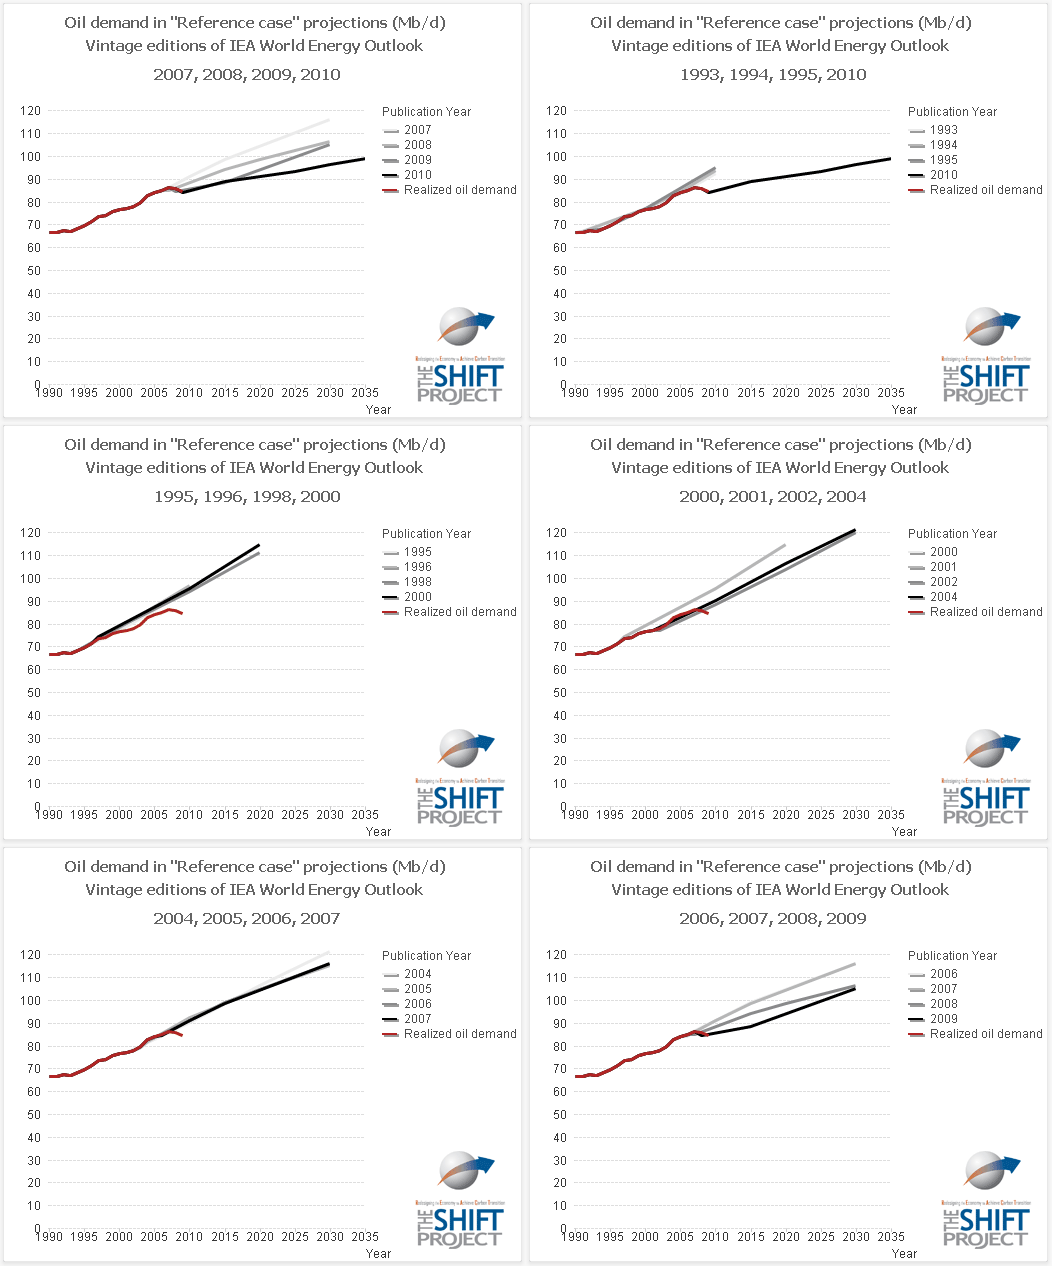
The following graph shows the evolution of past projections of International Energy Agency for world oil demand in World Energy Outlook.

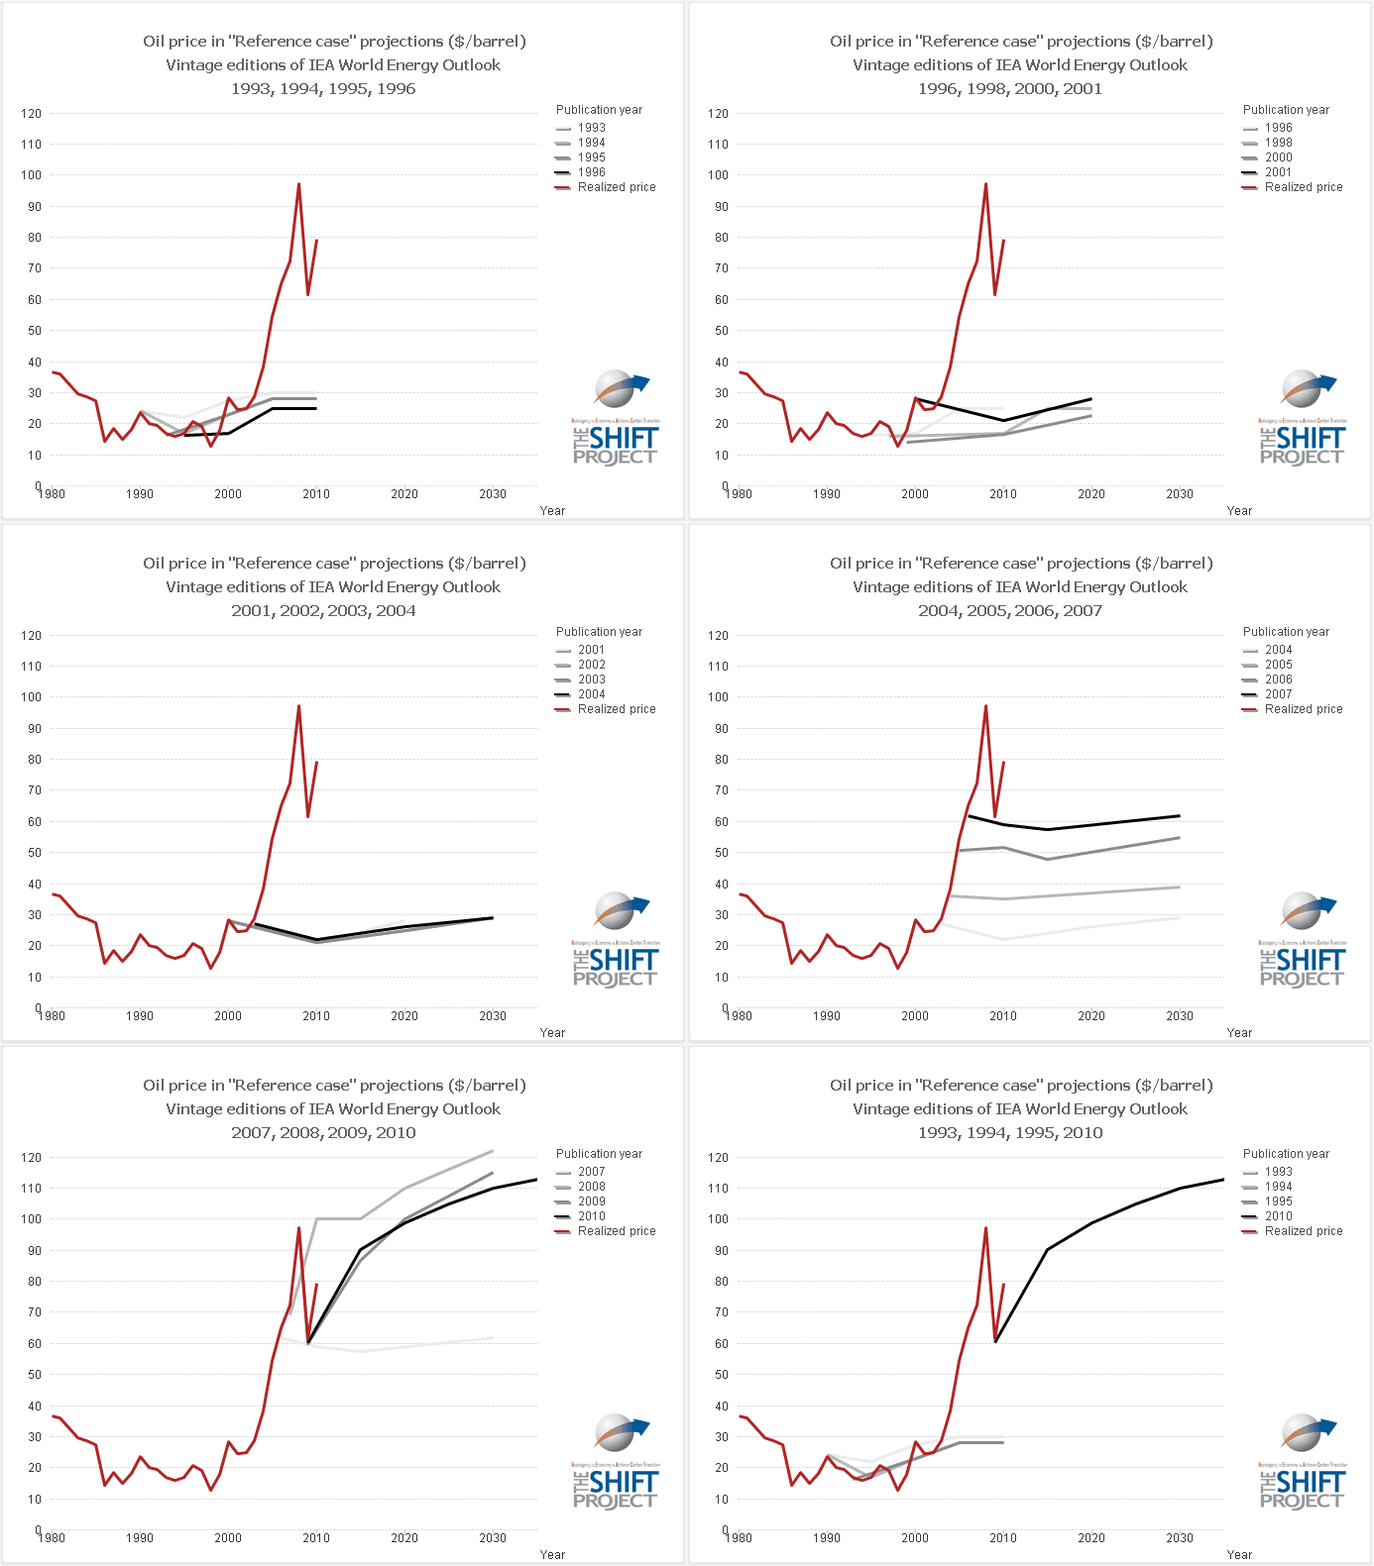
The following graph shows the evolution of past assumptions of International Energy Agency for world oil price in World Energy Outlook.

Details for data used:
World Energy Outlook:
Reference scenarios (1993, 1994, 1998, 2000, 2001, 2002, 2004, 2005, 2006, 2007, 2008 & 2009 editions)
Capacity constraints case (1995 & 1996 editions)
New Policies Scenario, 2010 edition
BP Statistical review of world energy 2011, world oil consumption

