The specific nature of climate risk is becoming increasingly important for most economic players and countries. This context favours an abundance of scenario methodologies for estimating and planning the necessary economic transition. The IEA being the main reference concerning energy transition scenarios, The Shift Project believes it is relevant to question its methodology.
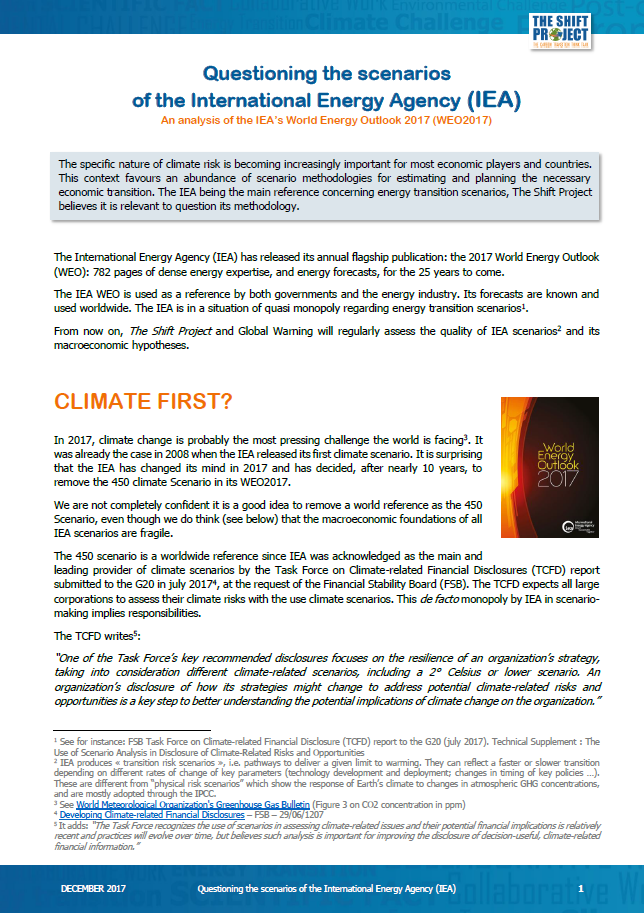 The International Energy Agency (IEA) has released its annual flagship publication: the 2017 World Energy Outlook (WEO): 782 pages of dense energy expertise, and energy forecasts, for the 25 years to come.
The IEA WEO is used as a reference by both governments and the energy industry. Its forecasts are known and used worldwide. The IEA is in a situation of quasi monopoly regarding energy transition scenarios[1].
From now on, The Shift Project and Global Warning will regularly assess the quality of IEA scenarios[2] and its macroeconomic hypotheses. The very first analysis is now available.
CLIMATE FIRST?
In 2017, climate change is probably the most pressing challenge the world is facing[3]. It was already the case in 2008 when the IEA released its first climate scenario. It is surprising that the IEA has changed its mind in 2017 and has decided, after nearly 10 years, to remove the 450 climate Scenario in its WEO2017.
We are not completely confident it is a good idea to remove a world reference as the 450 Scenario, even though we do think (see below) that the macroeconomic foundations of all IEA scenarios are fragile.
The 450 scenario is a worldwide reference since IEA was acknowledged as the main and leading provider of climate scenarios by the Task Force on Climate-related Financial Disclosures (TCFD) report submitted to the G20 in july 2017[4], at the request of the Financial Stability Board (FSB). The TCFD expects all large corporations to assess their climate risks with the use climate scenarios. This de facto monopoly by IEA in scenario-making implies responsibilities.
The TCFD writes[5]:
“One of the Task Force’s key recommended disclosures focuses on the resilience of an organization’s strategy, taking into consideration different climate-related scenarios, including a 2° Celsius or lower scenario. An organization’s disclosure of how its strategies might change to address potential climate-related risks and opportunities is a key step to better understanding the potential implications of climate change on the organization.”
The IEA has decided to replace the usual 450 Scenario by a Sustainable Development Scenario, which encompasses several objectives. IEA discovers sustainable development[6] in 2017 and that is good news.
We note new methodology principles for this scenario, such as:
- “The methodological approach adopted in the Sustainable Development Scenario is to focus first on universal access [to energy].”
- “There are however some aspects of the WEO that have not changed. One is the focus on objective data and dispassionate analysis. Another is the centrality of energy security, which is an important dimension of all the three main scenarios discussed in the WEO2017.”
- “This World Energy Outlook-2017 embraces this integrated approach through the development of a new Sustainable Development Scenario that aims to provide an energy sector pathway that combines the fundamentals of sectoral energy policy with three closely associated but distinct policy objectives.”
Beyond political correctness, this might open the door to uneasy arbitrage between different goals and objectives. “Access to energy” is important, as is “energy security”. Who knows what “the fundamentals of sectoral energy policy” mean? We hope that these important issues will not hinder the growing importance of the climate change issue which is of another scope: climate change is systemic, and it will have impacts for the millennia to come, for the whole of humankind.
Regarding climate change, another striking fact from the WEO2017 is the USA forecast, especially in the IEA New Policy Scenario: for year 2040, the CO2 emissions from coal figure is +18% higher than in the WEO2016. The trend one can figure out with this 2025-2040 forecast means that coal in the US which should have stopped emitting CO2 in 2090 (WEO2016), will stop emitting… in 2190 (WEO2017)!
ENERGY FIRST? OR HOW TO FUEL YOUR GDP
As usual, as every year, the IEA considers in its WEO that the Gross Domestic Product (GDP) has been created ex nihilo, or maybe by the International Monetary Fund (IMF) goddess! For the IEA, GDP, the wealth of nations, is created from scratch.
And then the IEA can deduce the economy, supply and demand of energy, like a manna from heaven: “Economic activity remains a primary driver of demand for energy.”
One could ask: How do you produce “economic activity”? Couldn’t it be with… energy?
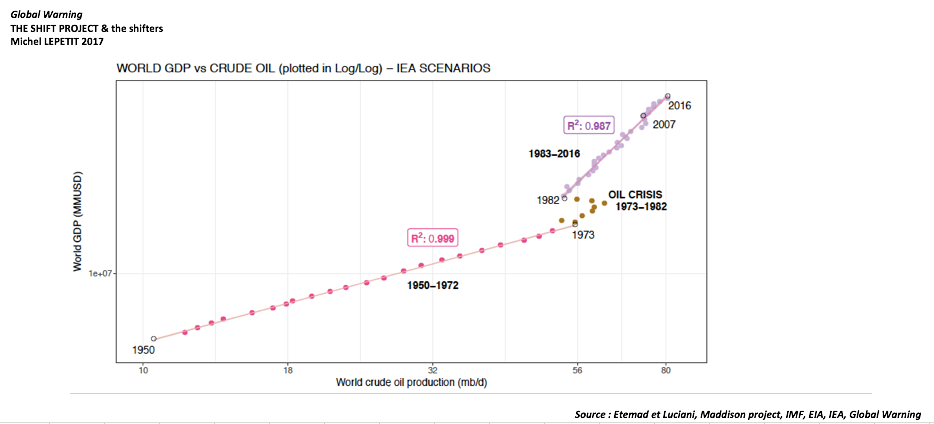
To better see that point and given the scale of past energy transitions, it seems to make sense to look back at our history[7]. Churchill once said: “The farther back you can look, the farther forward you are likely to see”. We decided to look back at 65 years of history (1950-2016) in order have a better hindsight of what is going to happen in the IEA forecast scenarios (2016-2040).
For The Shift Project, Global Warning has estimated and simulated in a graphic way, over the 1950-2016 period, and re-engineered for the IEA future (2017-2040) two key macroeconomic parameters: GDP[8] and oil production[9].
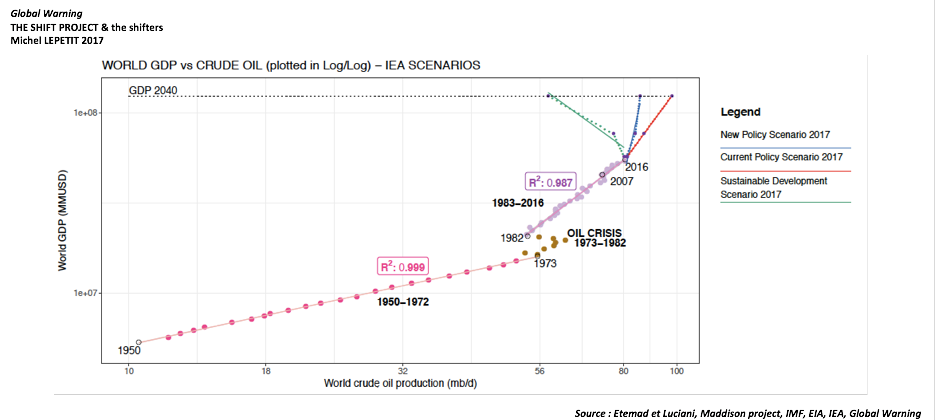
Each dot on the graphs represents the situation of the world for a given year. 1950 is on the bottom left, and 2016 is on the top right.[10]
The three IEA scenarios represented on the next graphs are:
- “Current Policy Scenario”, which means business as usual (in red);
- “New Policy Scenario”, which is supposed to be the IEA “central” scenario[11]. It takes into account political decisions and their impacts, as the COP21 individual commitments by all nations of the world (in blue);
- “450 Scenario” which was supposed to be compatible with the 2°C Paris Agreement objective; and which becomes in 2017: the “Sustainable Development Scenario” (in green).
The IEA explains:
“Given that rates of gross domestic product (GDP) growth are constant across the scenarios (…)”.
A miraculous consequence of the ex nihilo GDP creation hypothesis is that each of these scenarios will lead the world toward an identical level of economic development[12].
We wish the IEA were right. But one can wonder why this 450 path was not already taken, if it were that easy, painless, effortless, and “green growth”-compatible? Why would the USA be so reluctant to acknowledge the scientific facts of climate change, and so eager to quit the Paris Agreement? Might it be that a certain Mr. “nihilo” did not create world GDP in the first place?
Even the New Policy Scenario track seems difficult to follow. On the following graph, one can see the New Policy Scenarios from WEO2007 to WEO2017.
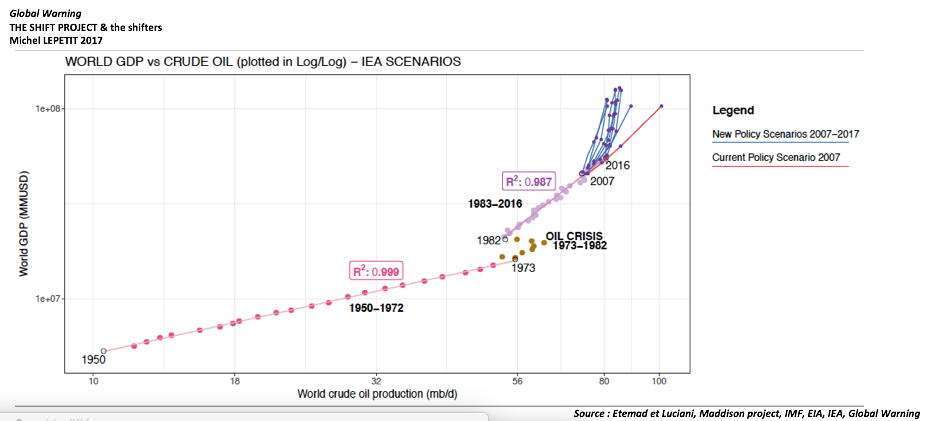
Interestingly, according to this graph, the world is on the oil/GDP track forecasted by the IEA in 2007. Unfortunately, the forecast track was the Current (Business As Usual) Scenario of 2007. And since 2007, the world has been doing just that: business as usual, which means as carbonized as usual. In the meantime, there was an economic crisis in 2008-2009, with a loss of GDP, as there was less oil available. And as the world engine has been using less oil, it did less business. So the “2017” dot on that path is the one forecasted in 2007 for the year… 2012! We are on the 2007 wrong track, we did not shift our trajectory, and we are 4 years late in growth…
OIL FIRST? DECOUPLING GDP FROM OIL: QUITE A CHALLENGE
Decoupling economic growth from energy consumption is one of the greatest challenges of the energy transition to come.
Global Warning historical analysis for The Shift Project shows for the last half-century that world oil consumption and world GDP are intertwined and tightly coupled. Three historical periods are represented in the graphs: the post-war boom of 1950-1973 (the so-called “trentes glorieuses” in France); the gloomy time of the two oil crisis of 1973-1982; followed by the years 1982-2016. Statistically, the coupling between oil and GDP has been very strong during the years 1950-1973 (goodness of fit R2= 0,999); as well as during the years 1982-2016 (R2 = 0,986). For these times, the yearly dots are well aligned on the graph.
Oil consumption means 100% CO2 emissions. The internal combustion engine is an efficient energy converter, but unfortunately, it cannot prevent greenhouse gas emissions! Things are different with electricity, which can be partly decoupled from CO2 emissions, thanks to hydraulic, to renewables or to nuclear solutions. The graph shows that GDP is strongly coupled with oil; and oil with CO2 emissions. It is as simple and as difficult as that.[13]
Aware of this economic reality, the three WEO2017 scenarios designed by IEA experts show strong coupling for the years 2017-2040 (see graph N°2)[14]. Somehow, each of the three IEA scenario tracks looks more as a new coupling, than a decoupling.
Looking at the history of the IEA WEO “climate” scenarios, things look even worse:
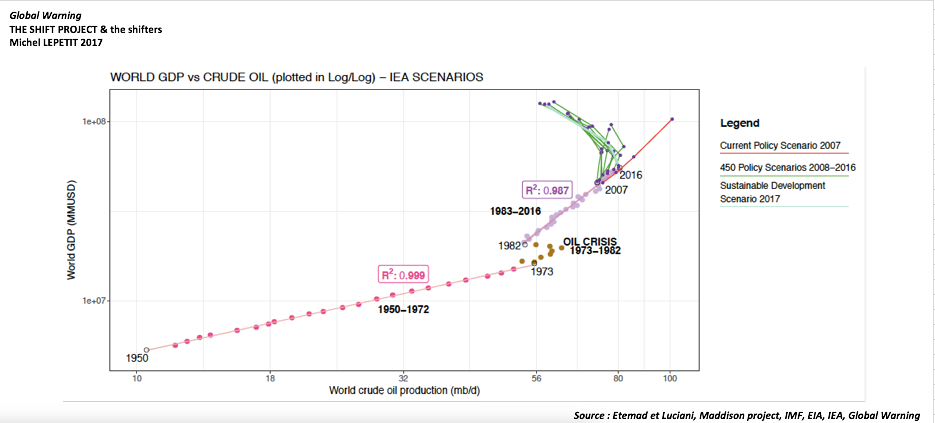
Be it the WEO2017 New Policy (in blue, graph 3) or Sustainable Development (in green, graph 4) scenarios of the WEOs, what is striking is that they imply a kind of trajectory shift, a shift which never happened smoothly in the past…
Contrary to Hegel’s saying, History teaches us something. The energy transition of the seventies marked by two violent oil shocks was a worldwide teaching in energy transition, and a painful one.
The IEA should not forget History: the first oil shock triggered IEA creation in 1974 in the wake of the oil crisis. The “sustainable development” IEA is discovering in 2017 was a real issue in 1973: past oil consumption trends were unsustainable in 1973: average world GDP growth was around +4,89% per year; and world average crude oil consumption was around +7,56% per year. Obviously, the world had to find a new way out of oil addiction. It took nearly ten years to figure out a more “sustainable” track…
Once again, if it were so painless and effortless to change the oil/GDP track, why didn’t we do it before 2017? A recent research[15] reveals that there was no plateau in 2014-2016 for the global carbon emissions due to global (not just oil) fossil consumption: unfortunately, 2017 world CO2 emissions should be higher.
—
[1] See for instance: FSB Task Force on Climate-related Financial Disclosure (TCFD) report to the G20 (july 2017). Technical Supplement : The Use of Scenario Analysis in Disclosure of Climate-Related Risks and Opportunities
[2] IEA produces « transition risk scenarios », i.e. pathways to deliver a given limit to warming. They can reflect a faster or slower transition depending on different rates of change of key parameters (technology development and deployment; changes in timing of key policies …). These are different from “physical risk scenarios” which show the response of Earth’s climate to changes in atmospheric GHG concentrations, and are mostly adopted through the IPCC.
[3] See World Meteorological Organization’s Greenhouse Gas Bulletin (Figure 3 on CO2 concentration in ppm)
[4] Developing Climate-related Financial Disclosures – FSB – 29/06/2017
[5] It adds: “The Task Force recognizes the use of scenarios in assessing climate-related issues and their potential financial implications is relatively recent and practices will evolve over time, but believes such analysis is important for improving the disclosure of decision-useful, climate-related financial information.”
[6] On sustainable development, one can read Laudato Si (esp. §59 and §194) by M. Bergoglio, or listen to Unsustainable… Sustainability was a word already used in France in 1346 (Edit de Brunoy).
[7] On the link between economic growth and electricity, one can look at this excellent global study : Bergeaud A., Cette G. & Lecat R. (2016) – The role of production factor quality and technology diffusion in the 20th century productivity growth – Document de travail – Banque de France
[8] GDP is a controversial indicator of wealth creation and its measure involves many questionable conventions. « World GDP » concept elaboration is even more fragile. However, it is commonly used in the economic literature, and a key indicator in the IEA modelling process and narrative.
[9] We monitor crude oil. And we focus on world crude oil production as a good proxy of world crude oil consumption.
[10] The world GDP is plotted on the horizontal axis. The world crude oil consumption/production is plotted on the vertical one. Both are plotted as logarithm.
[11] WEO2017 states that: “The New Policies Scenario is the central scenario of this Outlook, and aims to provide a sense of where today’s policy ambitions seem likely to take the energy sector. It incorporates not just the policies and measures that governments around the world have already put in place, but also the likely effects of announced policies, as expressed in official targets or plans. The Nationally Determined Contributions (NDCs) made for the Paris Agreement provide important guidance as to these policy intentions in many countries, although in some cases these are now supplemented or superseded by more recent announcements – including the decision by the US administration to withdraw from the Agreement.”
[12] The horizontal line at the top of the graph “GDP 2040”
[13] Somehow, the IEA recognizes the point about oil when it writes this global warning in the WEO2017: “However, it is a tall order for the other main end-use sectors – transport and industry – to deliver similar performance, as they are much more difficult to decarbonize. In the transport sector, oil consumption continues to grow in the New Policies Scenario (…) and, as a result, CO2 emissions from oil use in transport almost catch up with emissions from coal-fired power plants, which are flat. In industry, despite existing policies in many countries, which typically take the form of carbon prices or efficiency standards, the rise in industrial production and the lack of easy alternatives to fossil fuels in parts of this sector means that industry-related CO2 emissions continue to grow by more than 20% over the period to 2040.”
IEA WEO2017 adds: “The transport sector is the second-largest contributor to cumulative CO2 emissions savings, at around 20% of total savings relative to the New Policies Scenario. The pace of decline of transport emissions, however, does not nearly reflect its weight in emissions; by 2040, transport becomes the largest source of global CO2 emissions in the Sustainable Development Scenario, overtaking power generation. The reason is that combined emissions from road freight transport, shipping and aviation fall much more slowly than those of other sectors.”
[14] Unfortunately, for the WEO2017, IEA provides few dates to estimate the world crude oil production: 2025 and 2040. So the goodness of fit might seem meaningless here, but the coupling seems very strong, e.g. close to 1 for the current scenario.
[15] Global Carbon Project – November 2017: http://www.globalcarbonproject.org/carbonbudget/17/files/GCP_CarbonBudget_2017.pdf