22 January 2012
TSP-data-portal.org is now online !
Our data portal
Visit the website
The Shift Project team has the great pleasure to announce the publication of its Data Portal !
Tsp-data-portal.org gathers public data that can be exported just with a few clicks. Then you are free to use it for your keynotes or research analysis.
Information is organized in so called “datasets”. Each dataset allows you to generate a large number of graphs. You can easily browse data thanks to a user friendly design and with the help of a powerful business intelligence software called QlikView.
Today, the beta version of the portal contains about twenty datasets sorted out in three main categories:
Designed as an open platform, tsp-data-portal.org can host your contributions, ideas for new graphs or new analytics. (Contact)
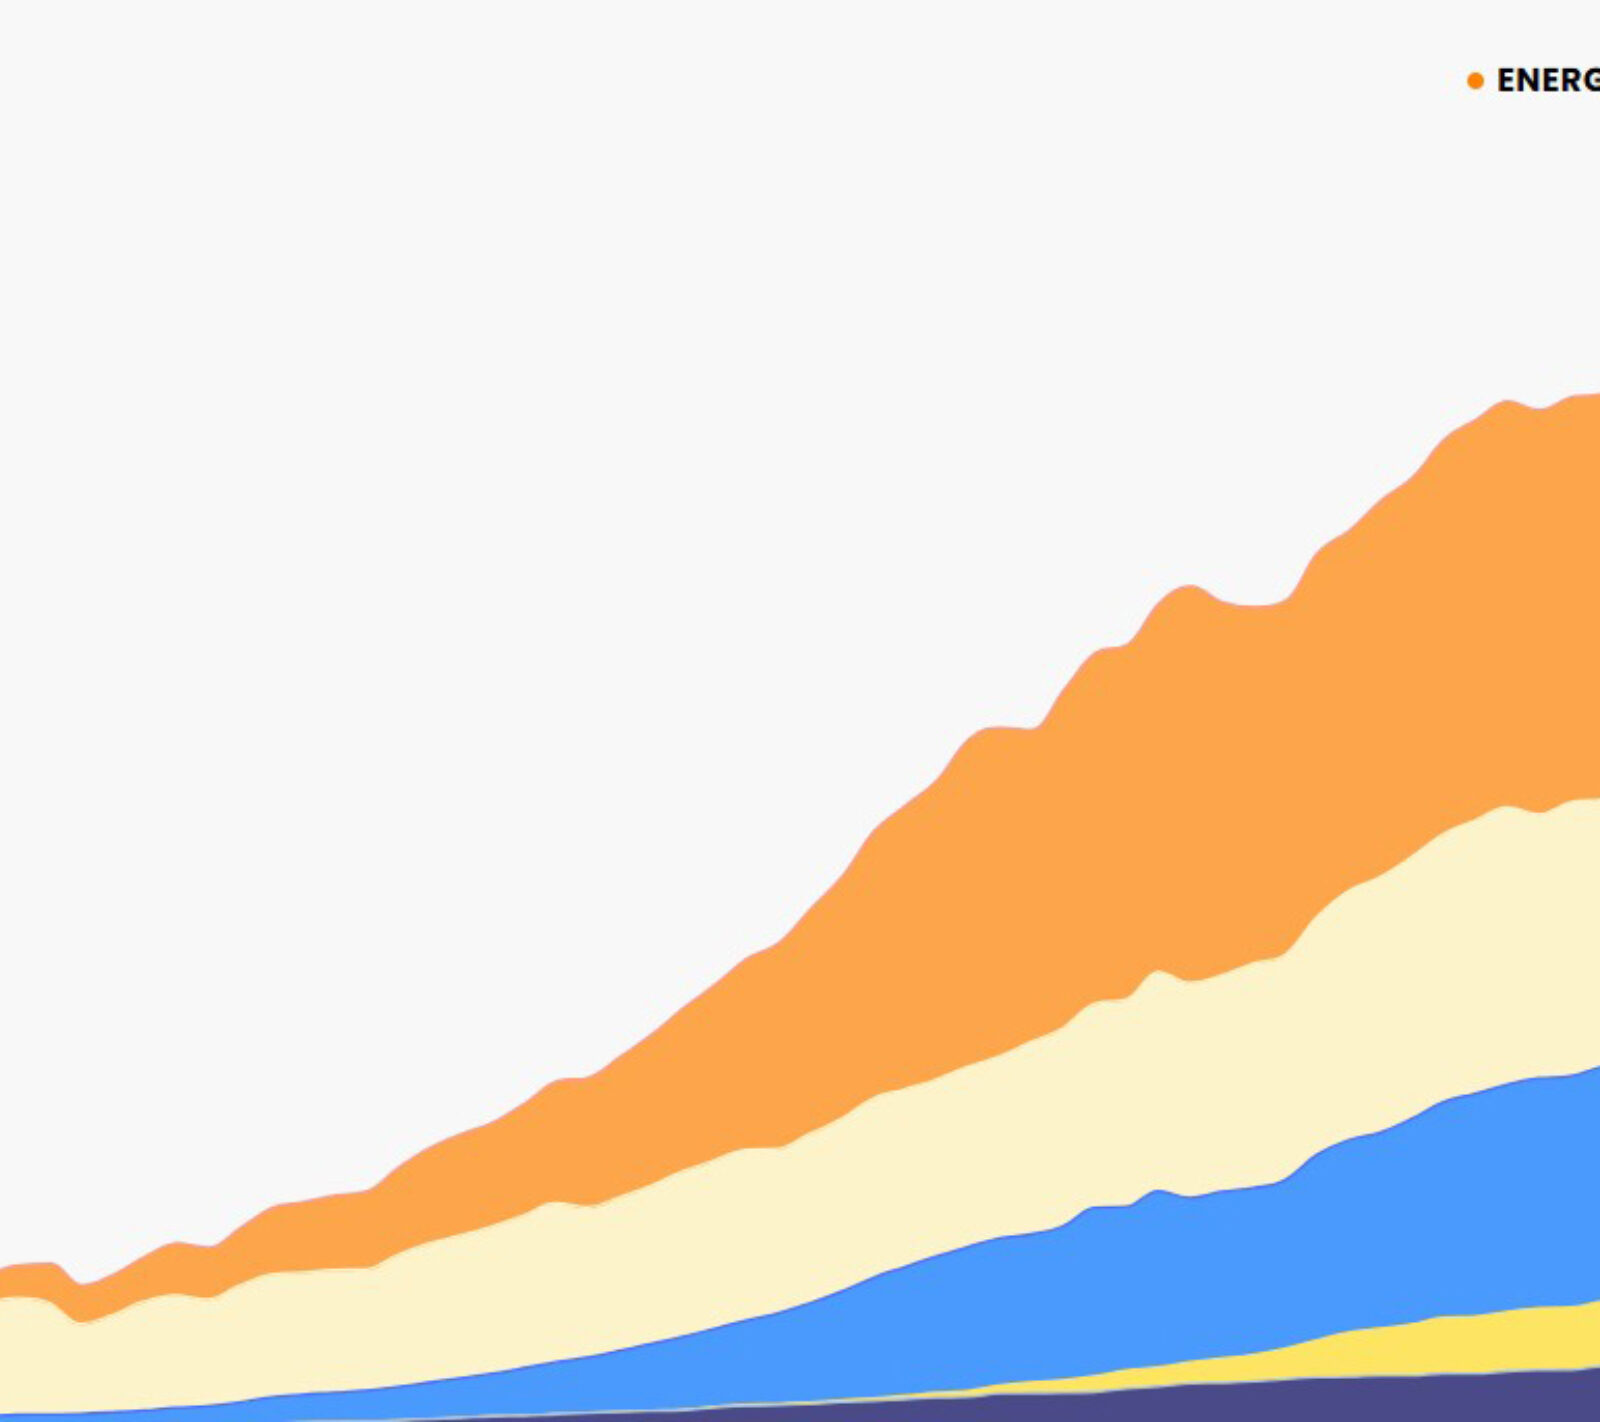
Right below, you can have an insight on primary energy production statistics for the 20th century. It consists of an iframe that you can easily include in your website or blog.
20 Jan. 2021|Blog
Is monetary policy (carbon) neutral ?

16 Apr. 2018|Blog
European Commission’s Action Plan for Sustainable Finance

19 May. 2017
Décarbonons ! 9 propositions pour décarboner l’Europe

24 Apr. 2017|Blog
Climate change: the economic world is calling upon the next president to set a (really) commensurate strategy with the Paris Agreement
