The add-on “Carbonalyser” allows to visualize the electricity consumption and greenhouse gases (GHG) emissions that your Internet browsing leads to.
Since october 2019 and thanks to Orange Labs, it is also available as an app: Mobile Carbonalyser.
Visualizing it will get you to understand that impacts of digital technologies on climate change and natural resources are not virtual, although they are hidden behind our screens.
- Download “Carbonalyser for Firefox” in the index of Firefox add-ons: https://addons.mozilla.org/fr/firefox/addon/carbonalyser/
- Download “Mobile Carbonalyser” on Google Play: https://play.google.com/store/apps/details?id=com.orange.labs.mobilecarbonalyser
To evaluate these impacts, the add-on:
- Measures the quantity of data travelling through your Internet browser,
- Calculates the electricity consumption this traffic leads to (with the “1byte” model, developed by The Shift Project),
- Calculates the GHG emissions this electricity consumption leads to, following the selected location.
Legal conditionsNone of your data are collected when using our add-on “Carbonalyser”: all browsing data are analyzed directly on the user device and are not sent or processed anywhere else in any way. The source code of this program is available in open access, to ensure transparency and for any other purpose: https://github.com/supertanuki/Carbonalyser. Add-on developed by Richard Hanna, designed by Gauthier Roussilhe, with help from Maxime Efoui-Hess for The Shift Project. |
How to use it
- Run the analysis with “Run analysis”.
- Browse the Internet as you usually do.
- Visualize results at any time, in real-time, by clicking on the add-on icon in your browser.
Results and data counting are erased when you close all windows of your Internet browser.
Features
- “Run analysis / Stop analysis” – run or stop the measuring of data volume travelling through the Internet browser. Results shown in the pop-up window are calculated for the cumulated running time.
- “Reset data” – erase measures and calculations made during the running time to reset the analysis to zero.
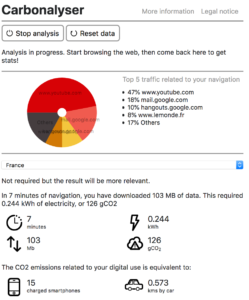
- Chart area – features rankings of the top 5 websites in terms of data traffic and their share in the total data volume generated by browsing the Internet.
- “Select your location” – allows to choose the electrical mix to apply in the calculations of GHG emissions (by default, if none is selected: average world mix is taken)
- Results area – features :
- Time during which the device has been running, from the start of the analysis,
- Quantity of data generated by Internet browsing,
- Electricity consumption generated by data traffic,
- GHG emissions this leads to,
- Comparison of GHG emitted by browsing and GHG emitted by charging a smartphone,
- Comparison of GHG emitted by browsing and GHG emitted by driving a car.
More information about the environmental impact of digital technologies
The box “How to change that? What responsibility?” links to publications from The Shift Project about environmental impact of our digital uses and solutions we have at individual and collective scales.
The Shift Project has indeed published its report “Climate crisis: the unsustainable use of online video : Our new report on the environmental impact of ICT“ about how digital uses contributes to the environmental impact of digital technologies: https://theshiftproject.org/en/article/unsustainable-use-online-video/
Methodology
Electricity consumption: the “1byte” model
The “1byte” model was developed by The Shift Project for its report “Lean ICT – Towards digital sobriety”, published in October 2018 (https://theshiftproject.org/en/article/lean-ict-our-new-report/).
It calculates the electricity consumption coming from data traffic, by modelling the electricity consumed by:
- Data centers through which data transfer,
- Networks infrastructures,
- The device used to browse the Internet.
There are two main hypothesis in the version of the “1byte” model used in the add-on:
- Device: devices consumption is calculated from an average consumption measured for smartphone and laptop ;
- Network: network consumption is calculated for WIFI network.
GHG emissions: location and electrical mix
The calculated electricity consumption is linked to GHG emissions by the carbon intensity factor of the selected location.
The factor describes emissions lead by electricity generation, following the electrical mix of the location:
- European Union : 0,276 kgCO2e/kWh
- France : 0,035 kgCO2e/kWh
- United States : 0,493 kgCO2e/kWh
- China : 0,681 kgCO2e/kWh
- Other (average world carbon intensity factor) : 0,519 kgCO2e/kWh